DevTools for Svelte,
inside Vite.
A Vite DevTools plugin for Svelte and SvelteKit. Fifteen specialized panels for inspecting components, profiling reactivity, debugging routes, and everything in between — without leaving your dev server.
Fifteen panels,
one workflow.
Every panel is opt-in, dev-only, and adds zero overhead to your production build. Mix and match — pick the ones you need, ignore the rest.
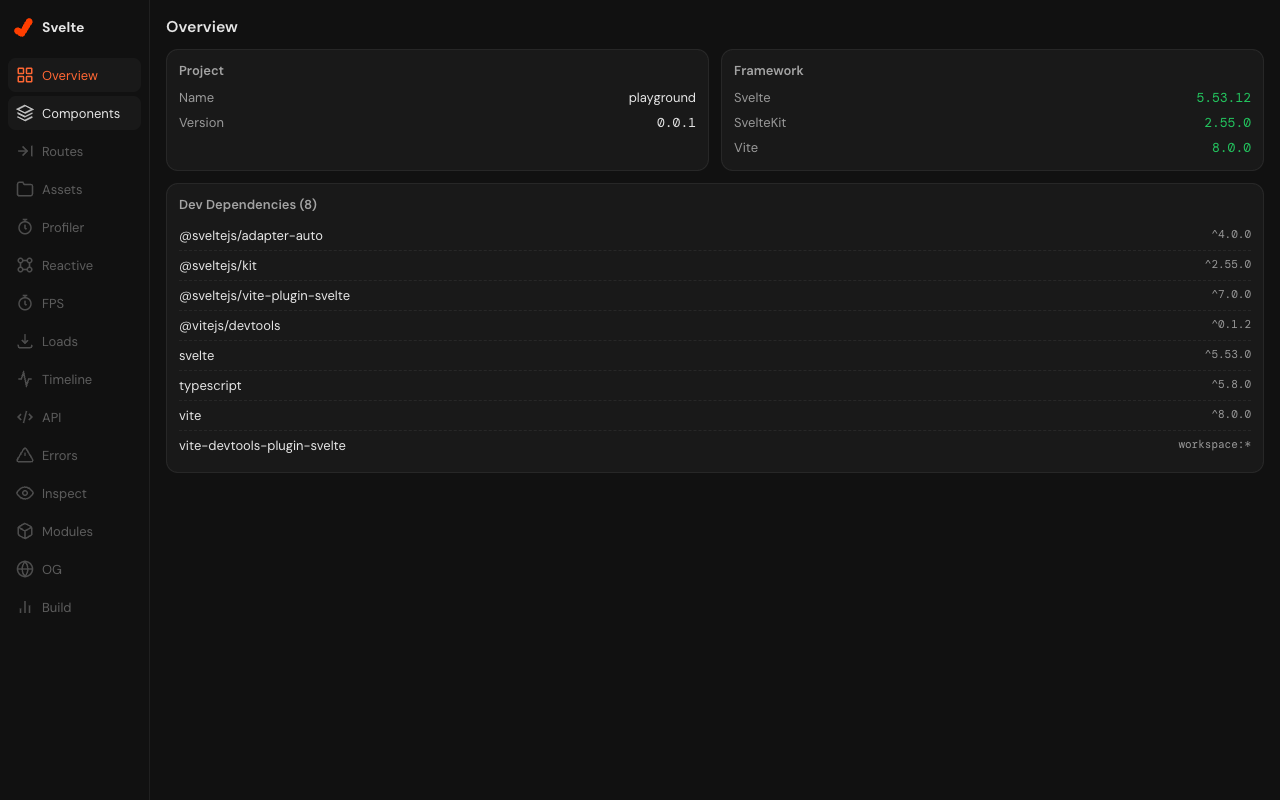
Overview
Project summary at a glance
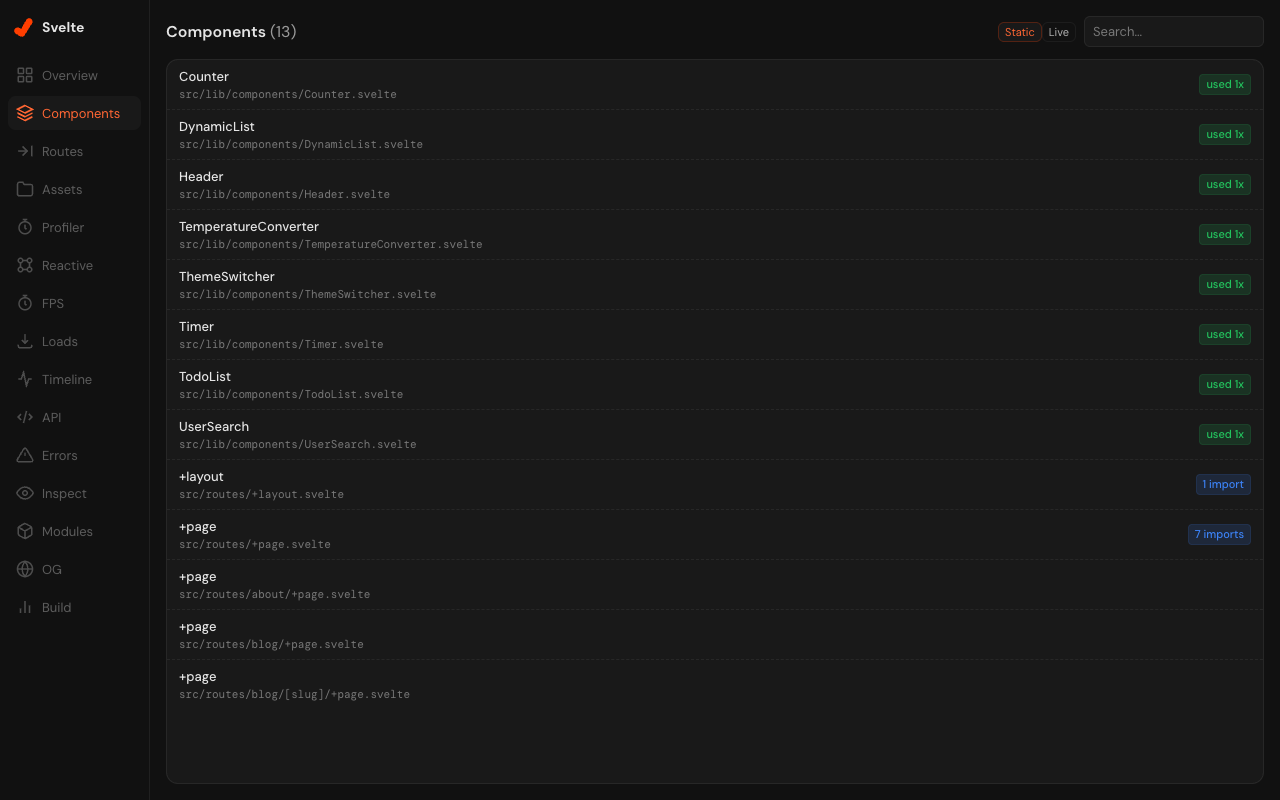
Component Inspector
Tree, props, state, and reactives in real time
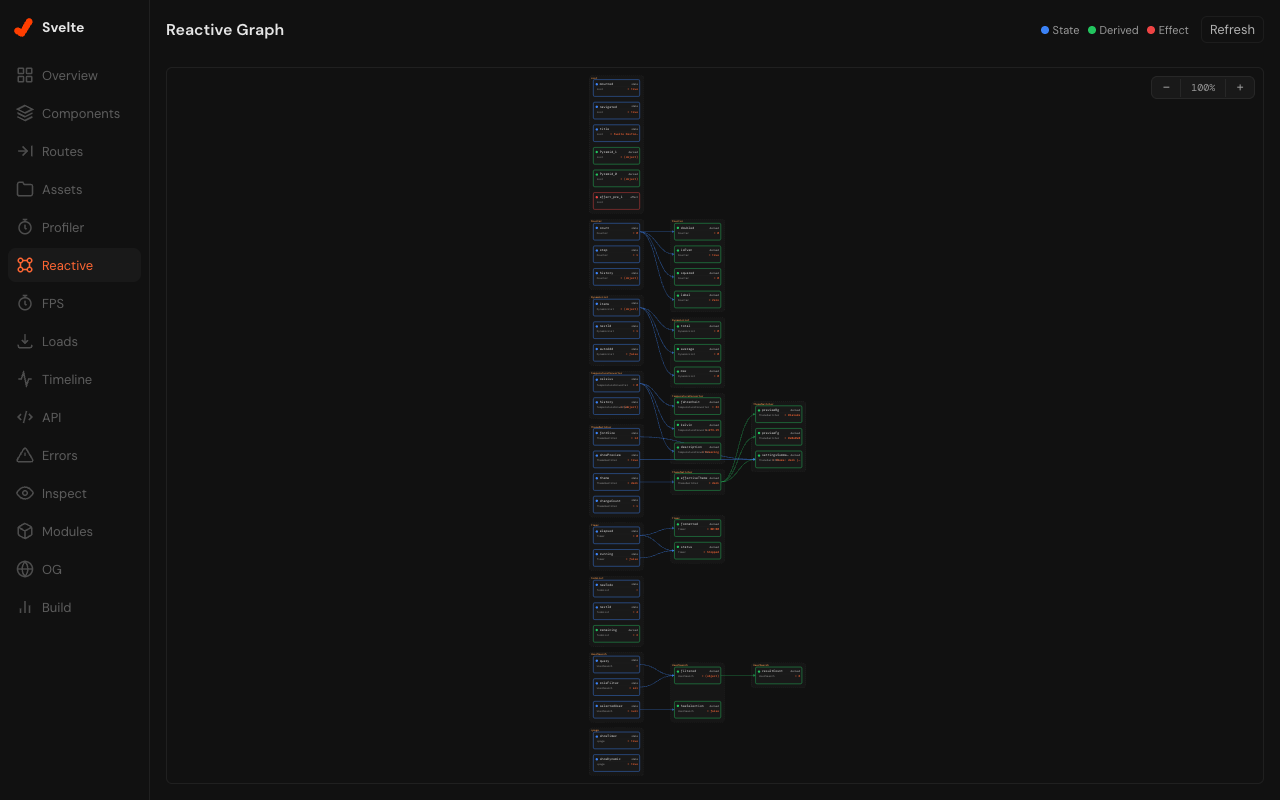
Reactive Graph
See how `$state`, `$derived`, and `$effect` connect
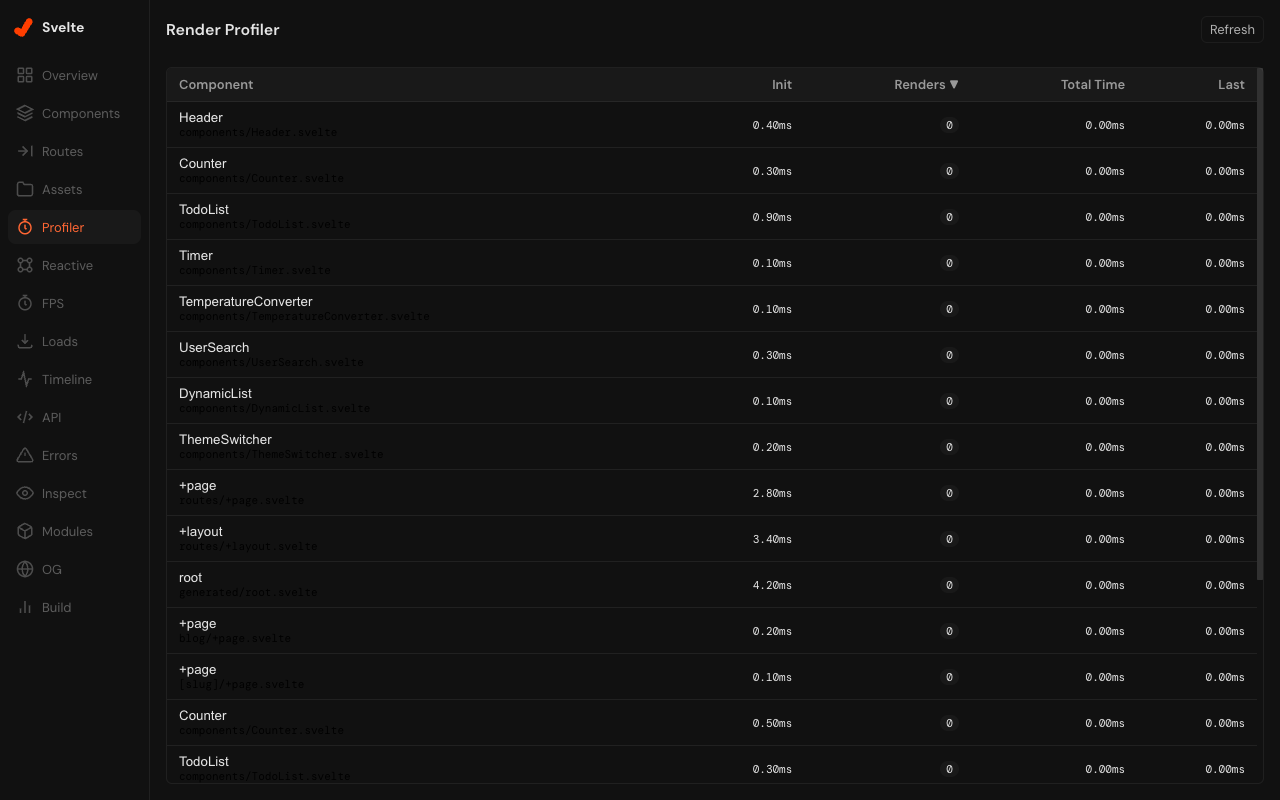
Render Profiler
Find the components that re-render too much
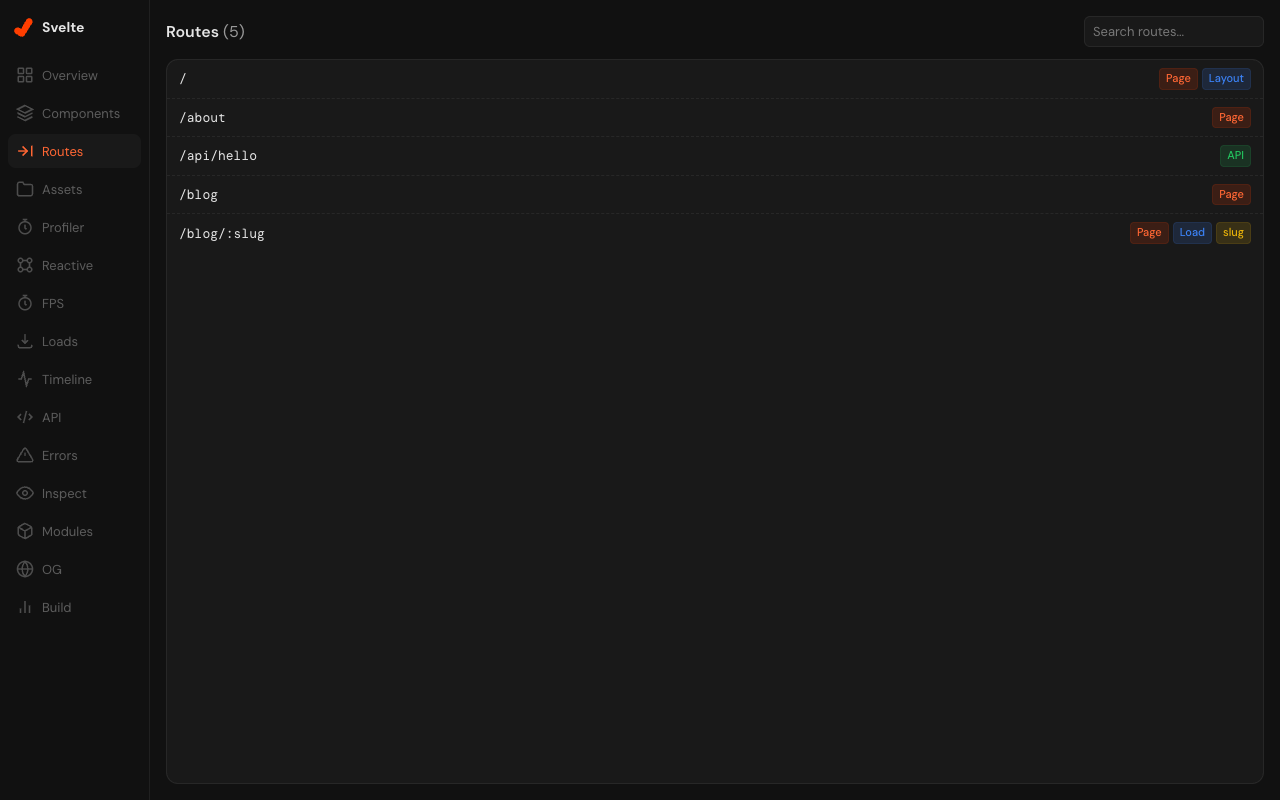
Route Viewer
SvelteKit file-based routing, visualized
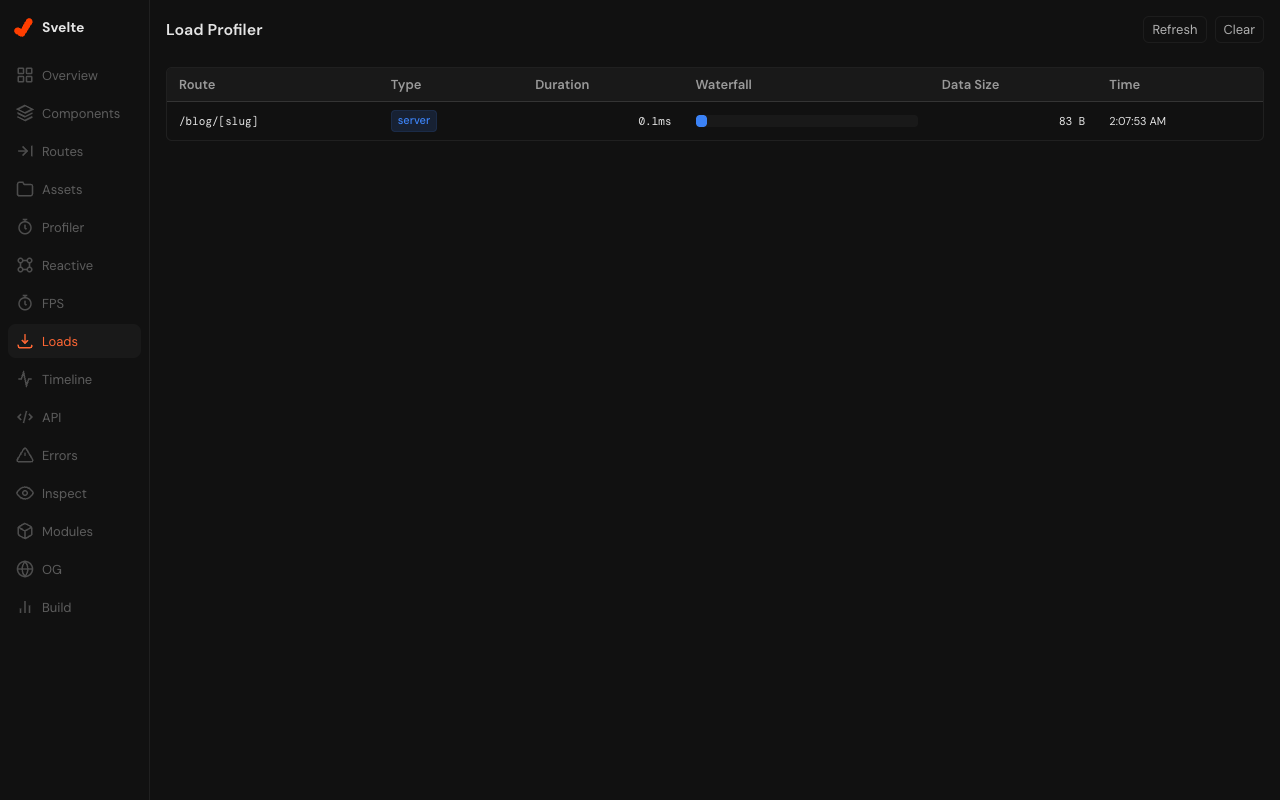
Load Profiler
Waterfall for SvelteKit `load` functions
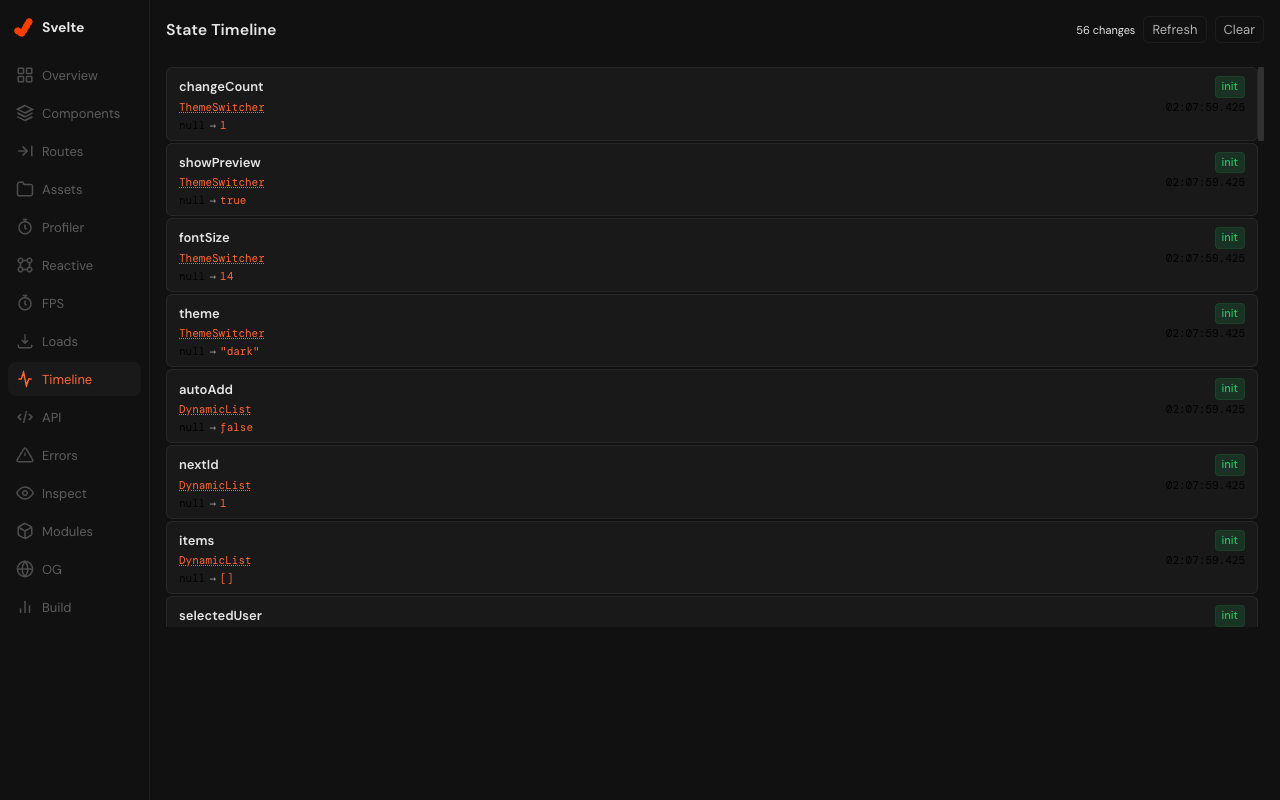
State Timeline
Record and replay state changes
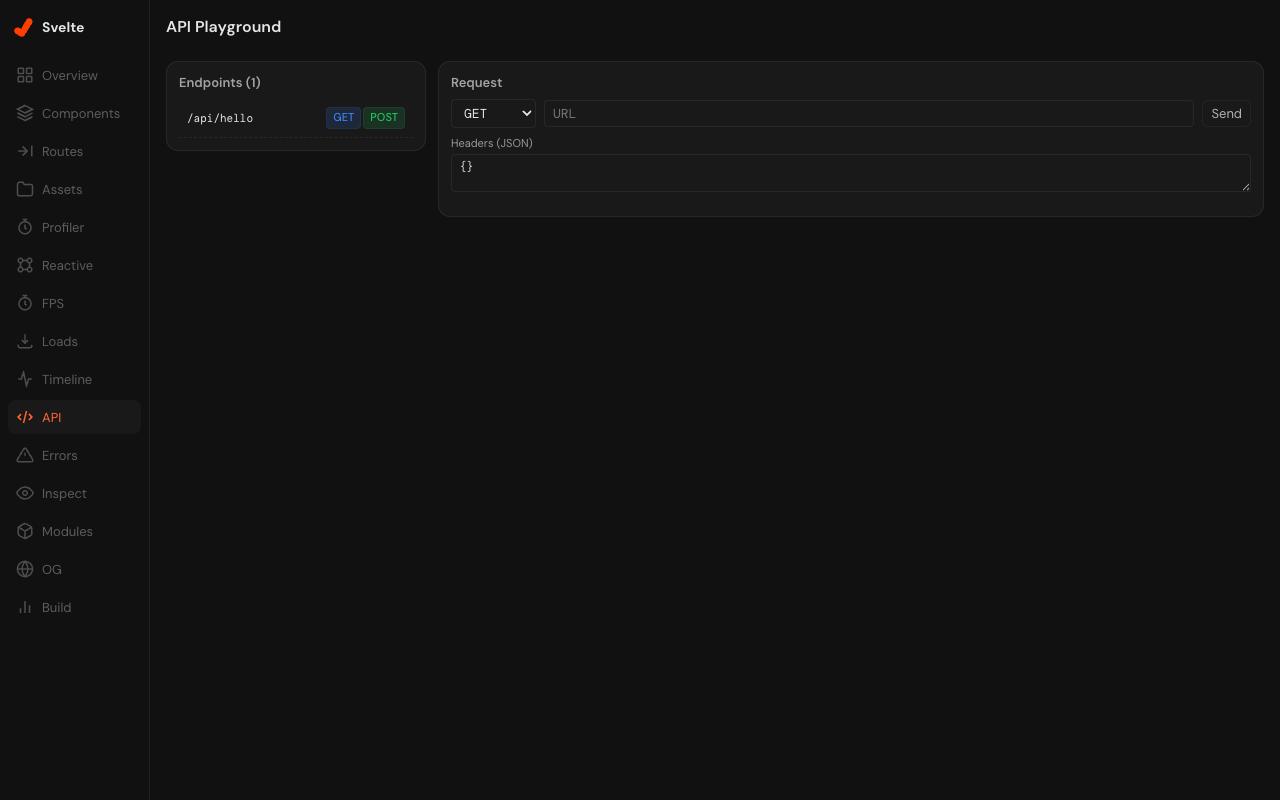
API Playground
Test `+server.ts` endpoints from DevTools
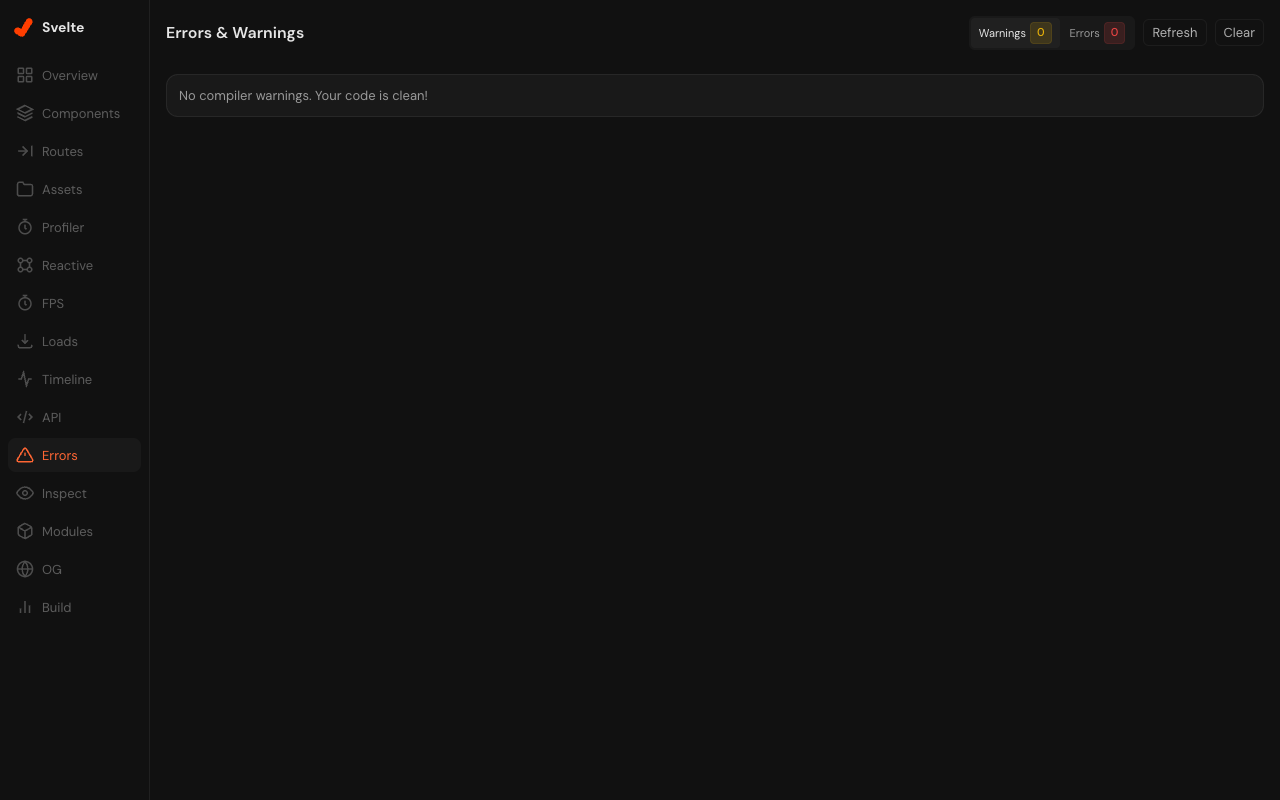
Errors & Warnings
Compiler and runtime issues in one place
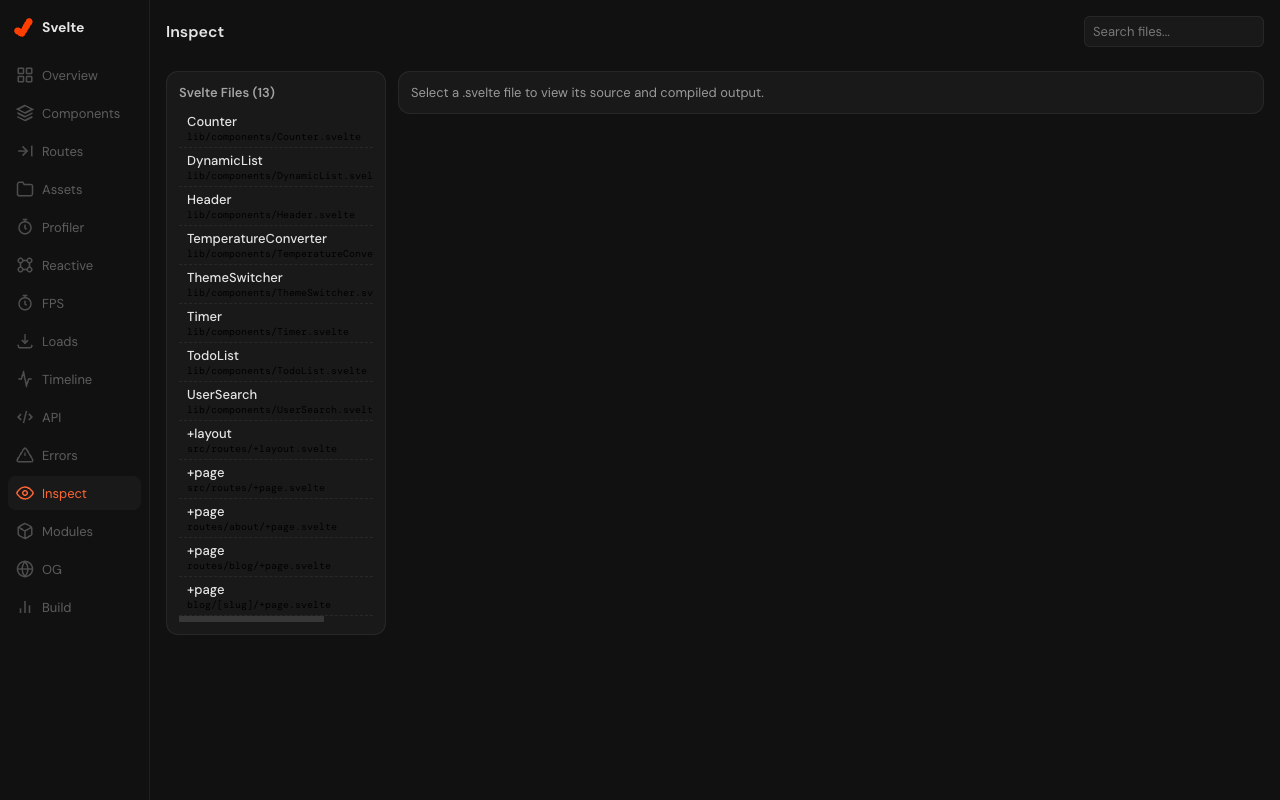
Code Inspector
See the compiled output for any Svelte file
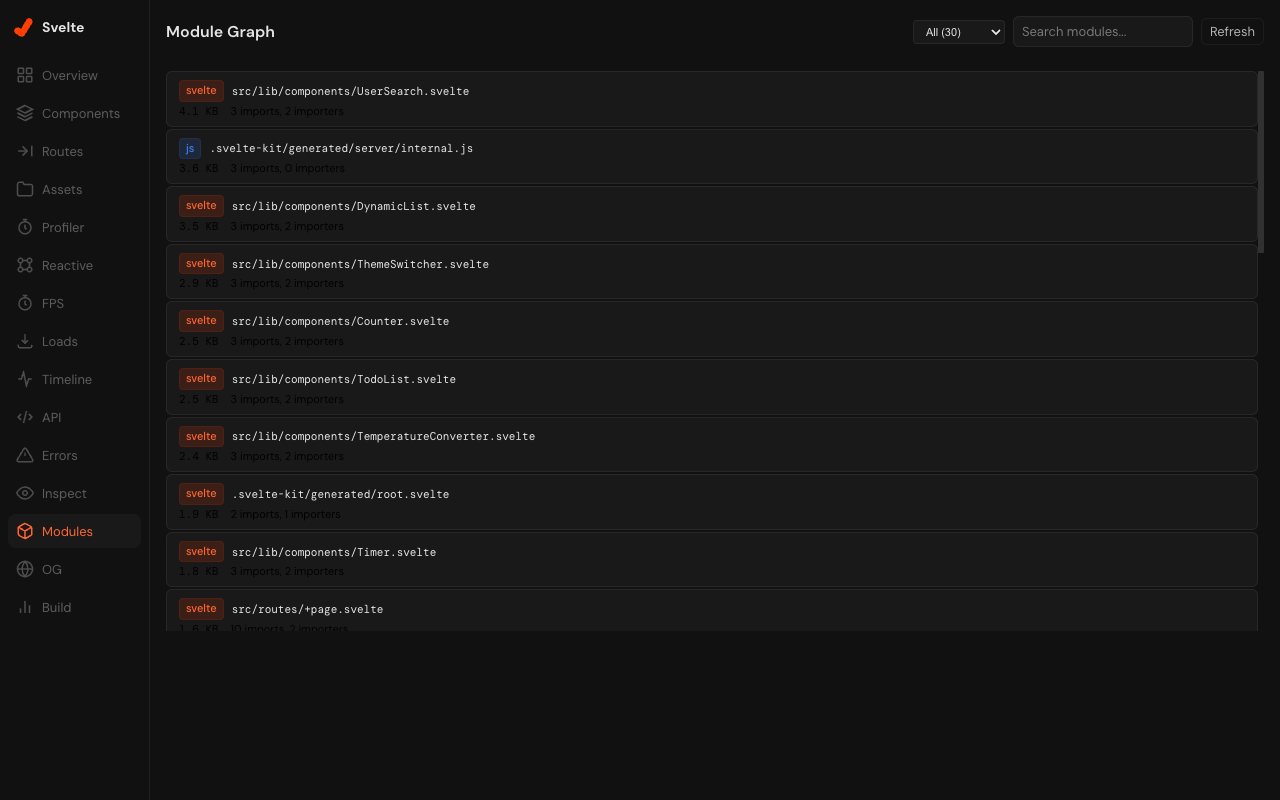
Module Graph
Dependency graph and circular import detection
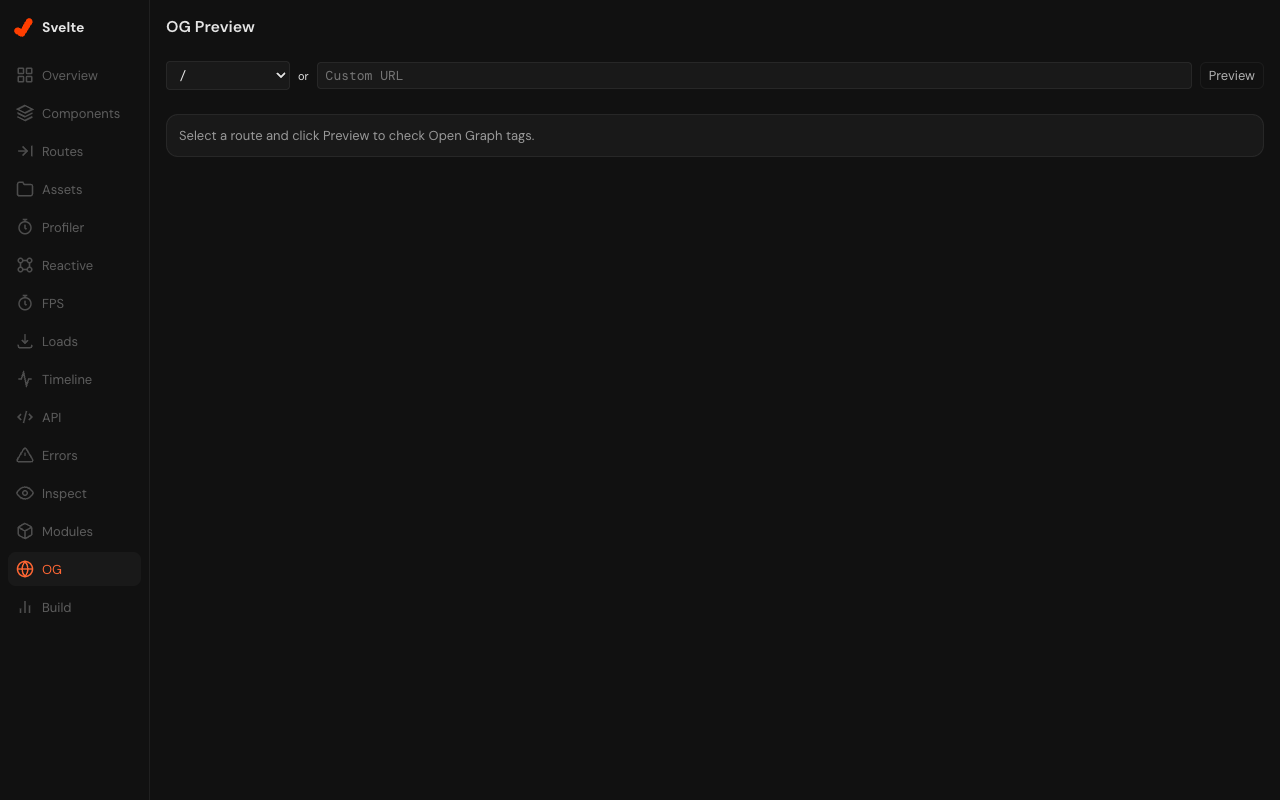
OG Preview
Validate Open Graph metadata for SEO
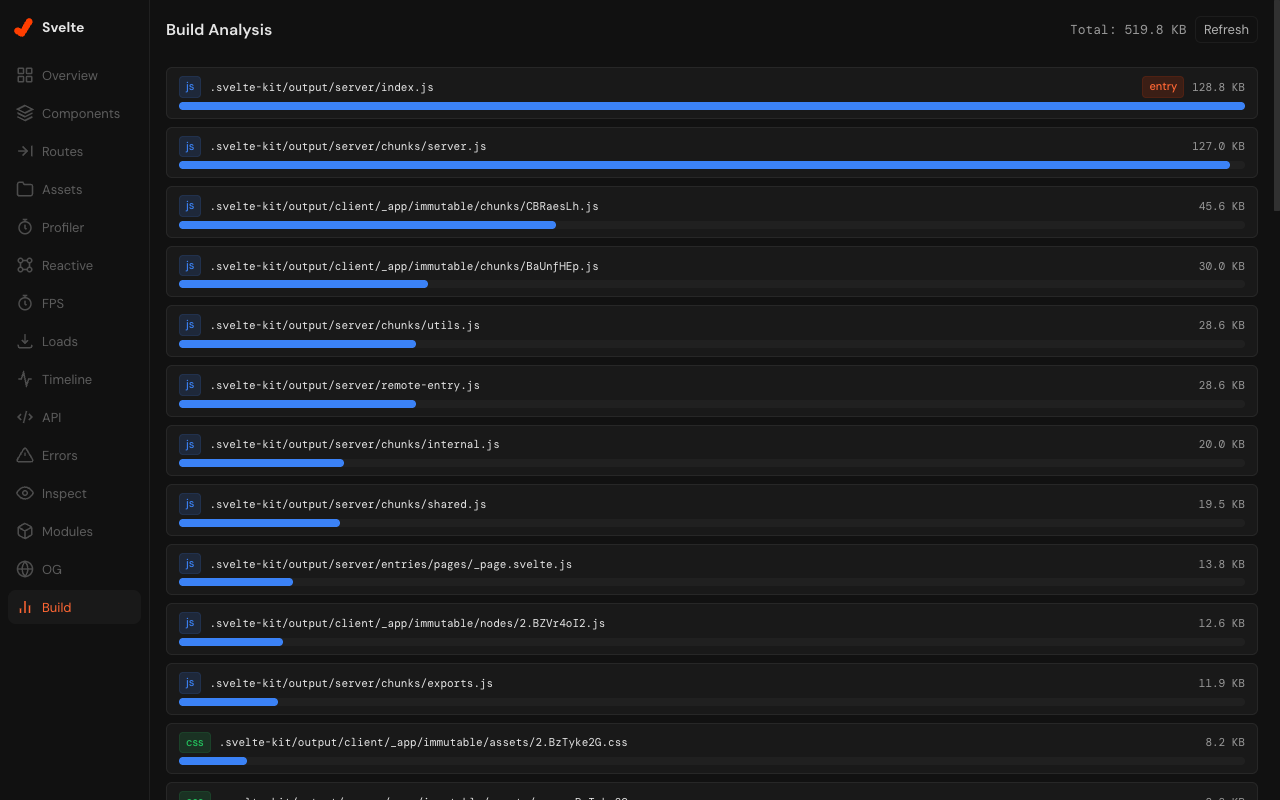
Build Analysis
Bundle composition without leaving DevTools
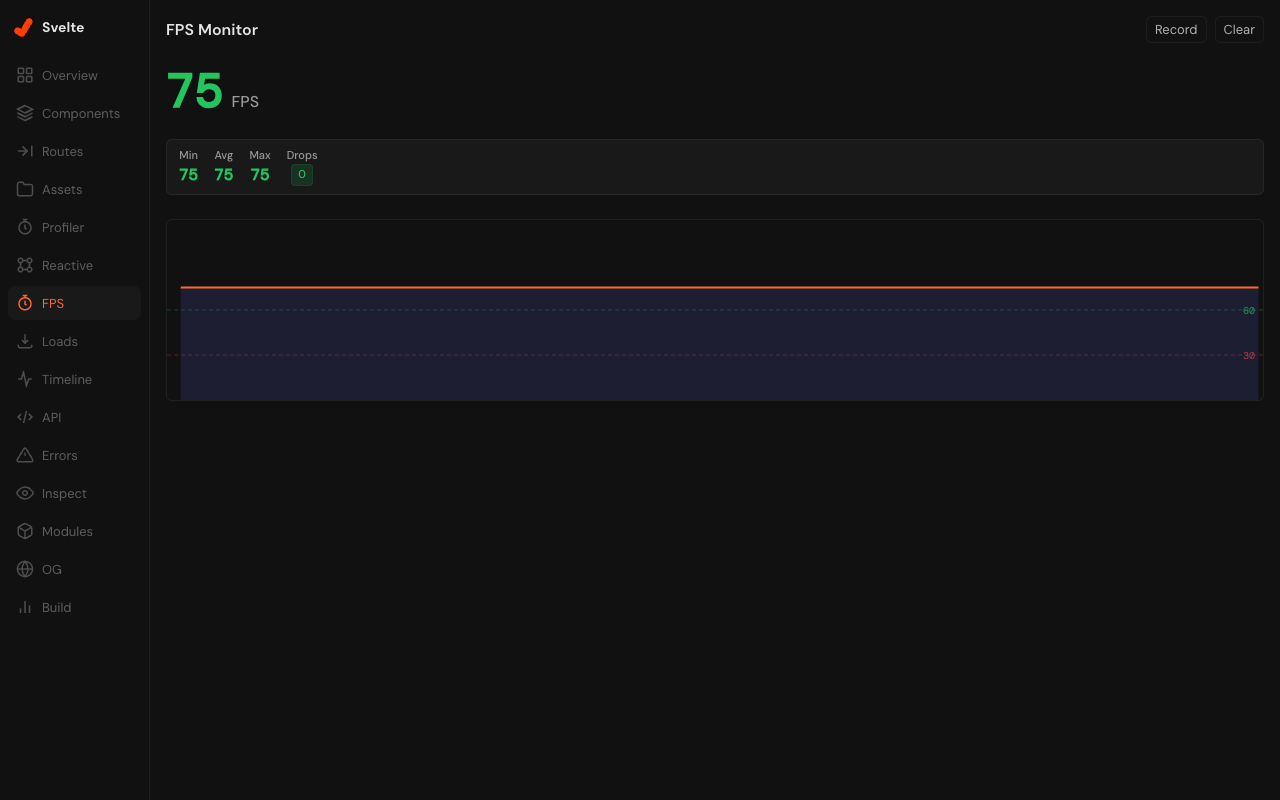
FPS Monitor
Real-time frame rate with history
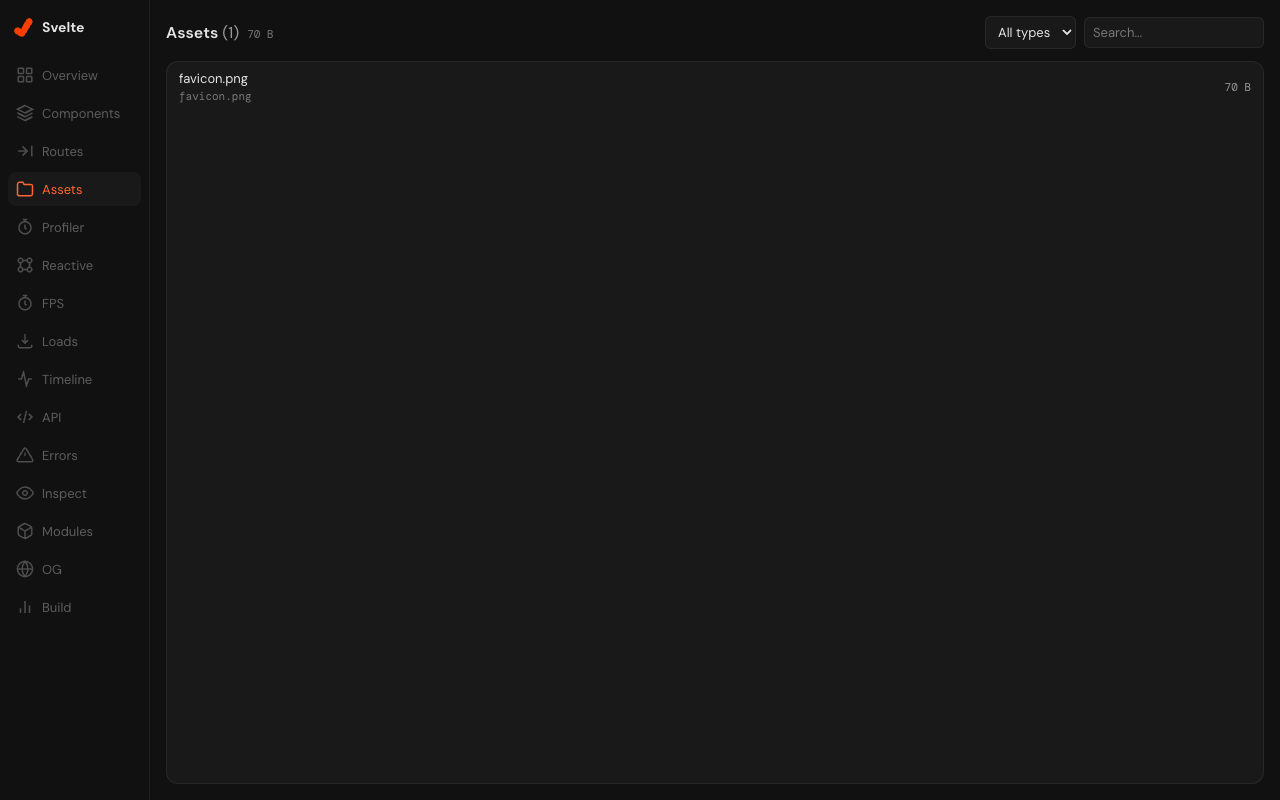
Asset Browser
Browse static assets with metadata
How it works.
A virtual-module architecture instead of fragile regex transforms. Runtime data flows out, static analysis flows in.
-
Runtime wrapper
in browserIntercepts svelte/internal/client to track component lifecycle and reactive signals — $state, $derived, $effect.
-
HMR channel
ws · dual-rpcStreams runtime data — component tree, render profiles, reactive graph — from the browser to the dev server via WebSocket.
-
Static analyzers
fsExtract routes, component relations, assets, and project metadata straight from the filesystem — no runtime instrumentation needed.
-
DevTools panels
in devtoolsMounted in the Vite DevTools Kit shell. Dev-only, opt-in, with HTTP fallback for older DevTools Kit versions.
Open the workshop.
Three lines of config. No production code touched. Drop the plugin into a Svelte 5 + Vite 8 project and the panels appear in your DevTools sidebar.
// vite.config.ts
import { svelteDevtools } from 'vite-devtools-svelte'
import { sveltekit } from '@sveltejs/kit/vite'
import { defineConfig } from 'vite'

export default defineConfig({
  plugins: [
    svelteDevtools(),
    sveltekit(),
  ],
})